Monitoring_
Watch compute, connections, storage, and workload metrics live, inspect active connections, and check database health on your PostgreSQL database.
2 min read
Every native database ships with built-in observability: live metrics in the Console, an active-connections inspector, and programmatic health checks. There is nothing to install; metrics collection runs next to the database.
Monitor tab
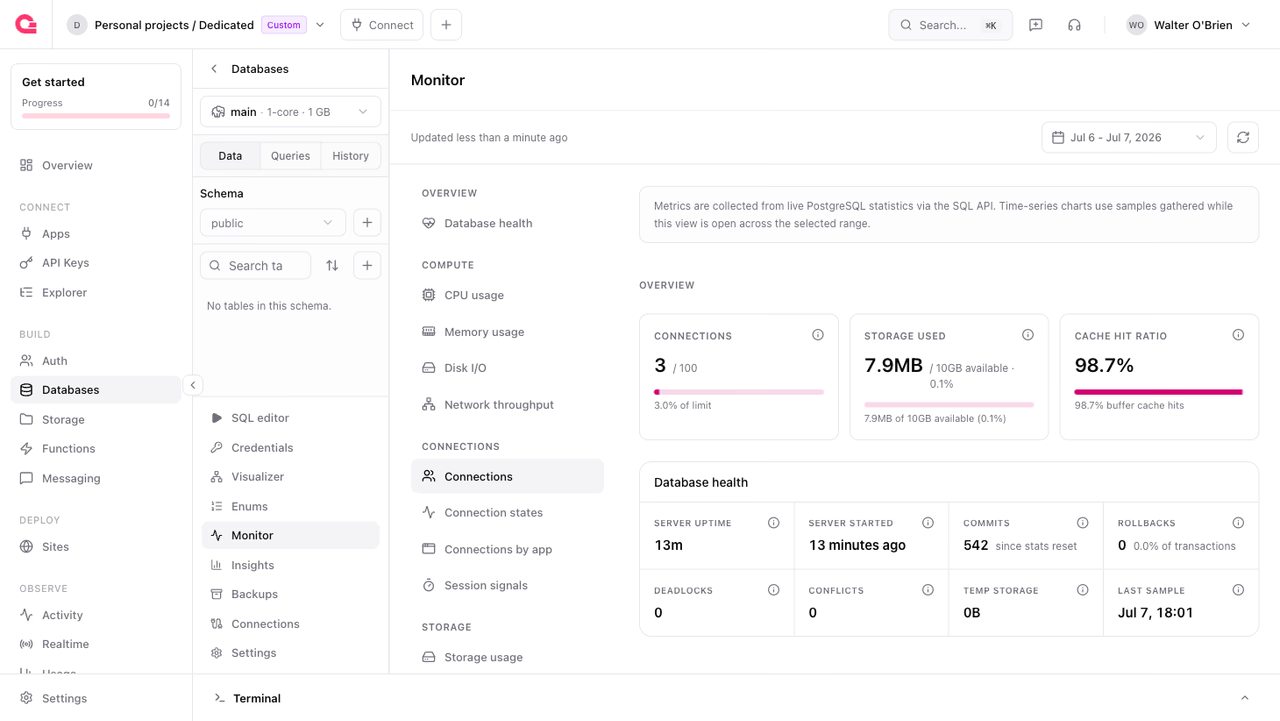
Open your database and select the Monitor tab. The view is organized into sections:
- Overview: key health indicators at a glance, including connection usage against your limit, storage used, cache hit ratio, uptime, and commit/rollback counts
- Compute: CPU and memory usage over time
- Connections: connection counts by state and by application
- Storage: disk usage and growth
- Workload: query throughput and activity
Use the date range picker to zoom into an incident window, and Refresh metrics to pull the latest samples.
A healthy OLTP database typically shows a cache hit ratio above 99%. A sustained lower ratio means the working set does not fit in memory, which is usually solved by moving up a specification.
Active connections
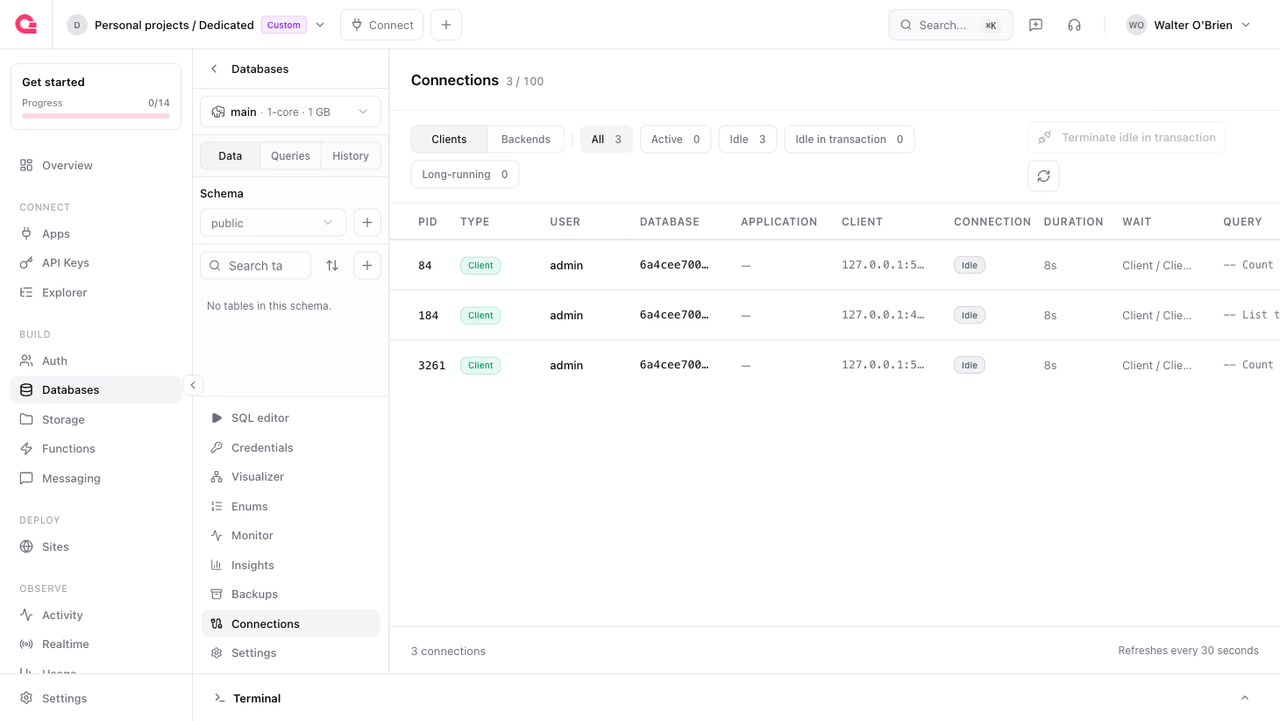
The Connections tab lists live connections from PostgreSQL's pg_stat_activity, with the connection state, duration, client, application name, and current query for each.
You can filter by state (Active, Idle, Idle in transaction, Long-running), and act on problem connections directly: cancel a running query, terminate a connection, or terminate all idle-in-transaction sessions at once. Idle-in-transaction sessions hold locks and block vacuum, so terminating them is often the fastest way to unblock a stuck workload.
Database health
Poll the database status for live health information: readiness, uptime, connection counts, replica state, and storage volumes. Use it from deploy pipelines to wait for the database, or from your own monitoring:
For the database lifecycle state (ready, scaling, restoring, and friends), read the status field of the database object itself; see lifecycle states.
Explain a query
The Console's SQL editor tab has an Explain button that shows the execution plan for the query in the editor, without leaving the browser. Use it to check whether a slow query uses your indexes before reaching for EXPLAIN ANALYZE in psql.
Was this page helpful?
Share what worked or what we should fix. Once approved, our agents automatically apply suggested updates to the docs.